PC battery year one stats
This visualization covers the first year since first boot.
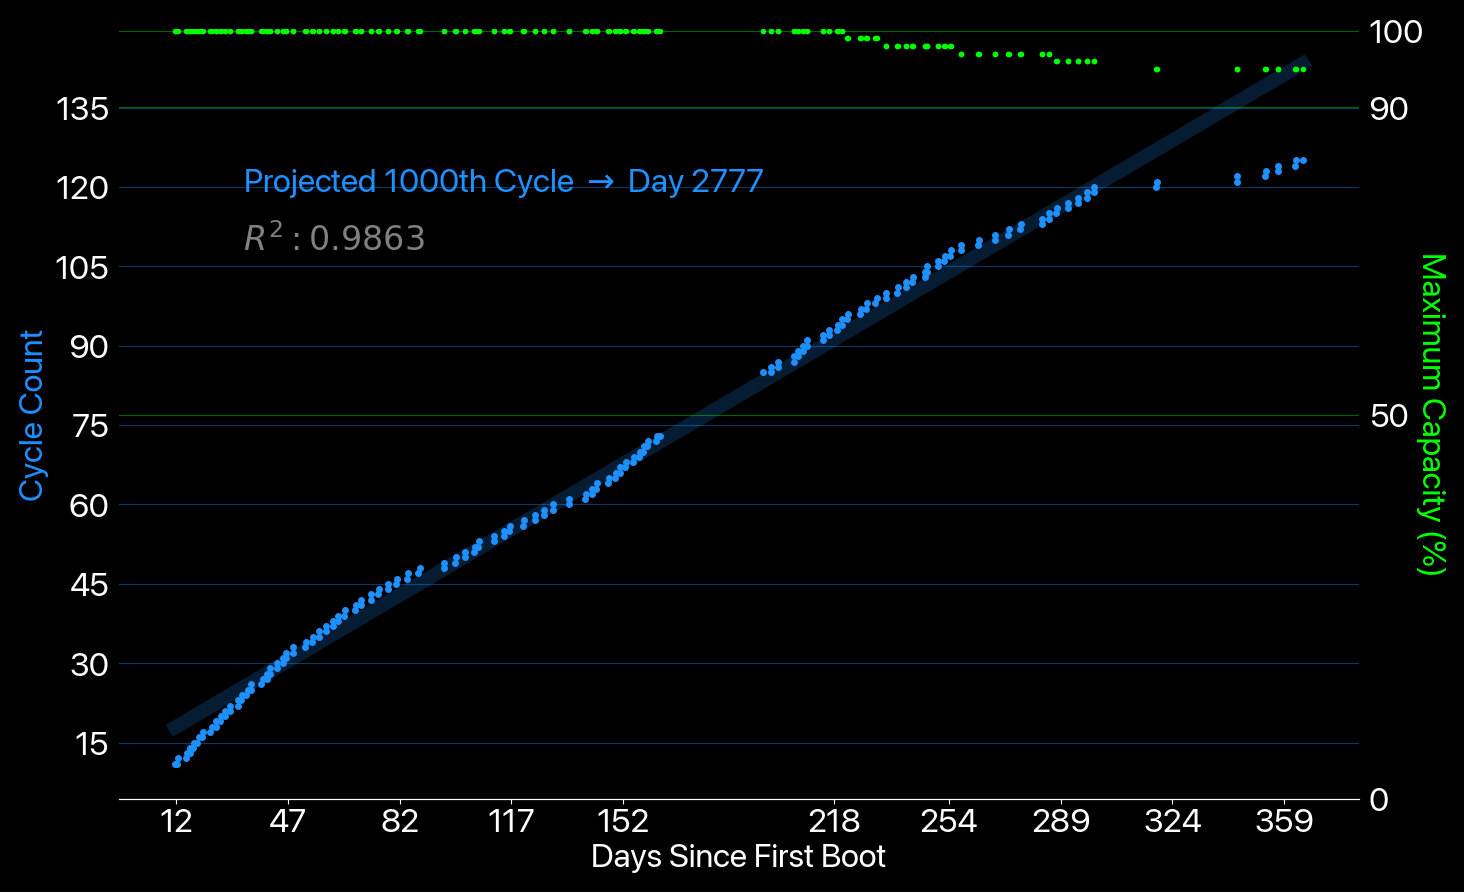
Oh, of course, for determining the projected doomsday (1000th cycle day), I am going all out, with Linear Regression! Who needs other models when you have the simplicity and elegance of a straight line fit? It's not like there could be any nonlinear relationship in my data.
/s
technology
logging
visualization
Original note: 2023-XX-XX